Table
The <Table> is a structured component used to organize and display tabular data in rows and columns. It enhances the functionality of regular <table> elements with the possibility to interact and select the data, and helps with accessibility by enabling keyboard navigation.
Tabular data is a structured form of data that is organized in rows and columns and resembles a table format.
Our table allows user to selecting one or multiple rows, it includes an action cell, and supports sorting columns. Additionally, it features a sticky header, can stretch to full size, and allows columns to be aligned to the left, center, or right. The table also supports nesting columns and having fixed column widths.
These features will be explained in more detail in the usage section further down the page.
Anatomy
A table is composed of a container element that organizes data into rows and columns. Each cell within the table can hold either plain text or focusable elements. If the table allows multiple row selection, the first column of each row include a checkbox for selecting that row and the first column header will contain a "select all" checkbox.

Appearance
The appearance of a component can be customized using the variant and size props. These props adjust the visual style and dimensions of the component, available values are based on the active theme.
| Id | Event | Date |
|---|---|---|
| 1234 | Concert | Mittwoch, 10. Januar 2024 |
| 82374 | Open Air Festival | Dienstag, 9. Juli 2024 |
| 724423 | Live on Stage | Montag, 25. November 2024 |
| 23497 | Open Air Summertime | Samstag, 1. Juni 2024 |
| Property | Type | Description |
|---|---|---|
variant | default | grid | muted | admin | master | The available variants of this component. |
size | - | The available sizes of this component. |
Usage
Use a <Table> if you need to organize and display large amout of data.
Grouping informations provide a structured and organized way to display data, making it easier to understand and analyze.
Tables allow you to group related information in a clear and concise manner, which enhances data readability and comprehension.
They are ideal for comparing data points. Unlike cards, tables enable users to compare multiple rows and columns without having to move their eyes too much or rely on memory. Also with the support of single or multiple row actions, they make it convenient to perform data-specific actions such as deleting, sharing, or editing records directly within the table.
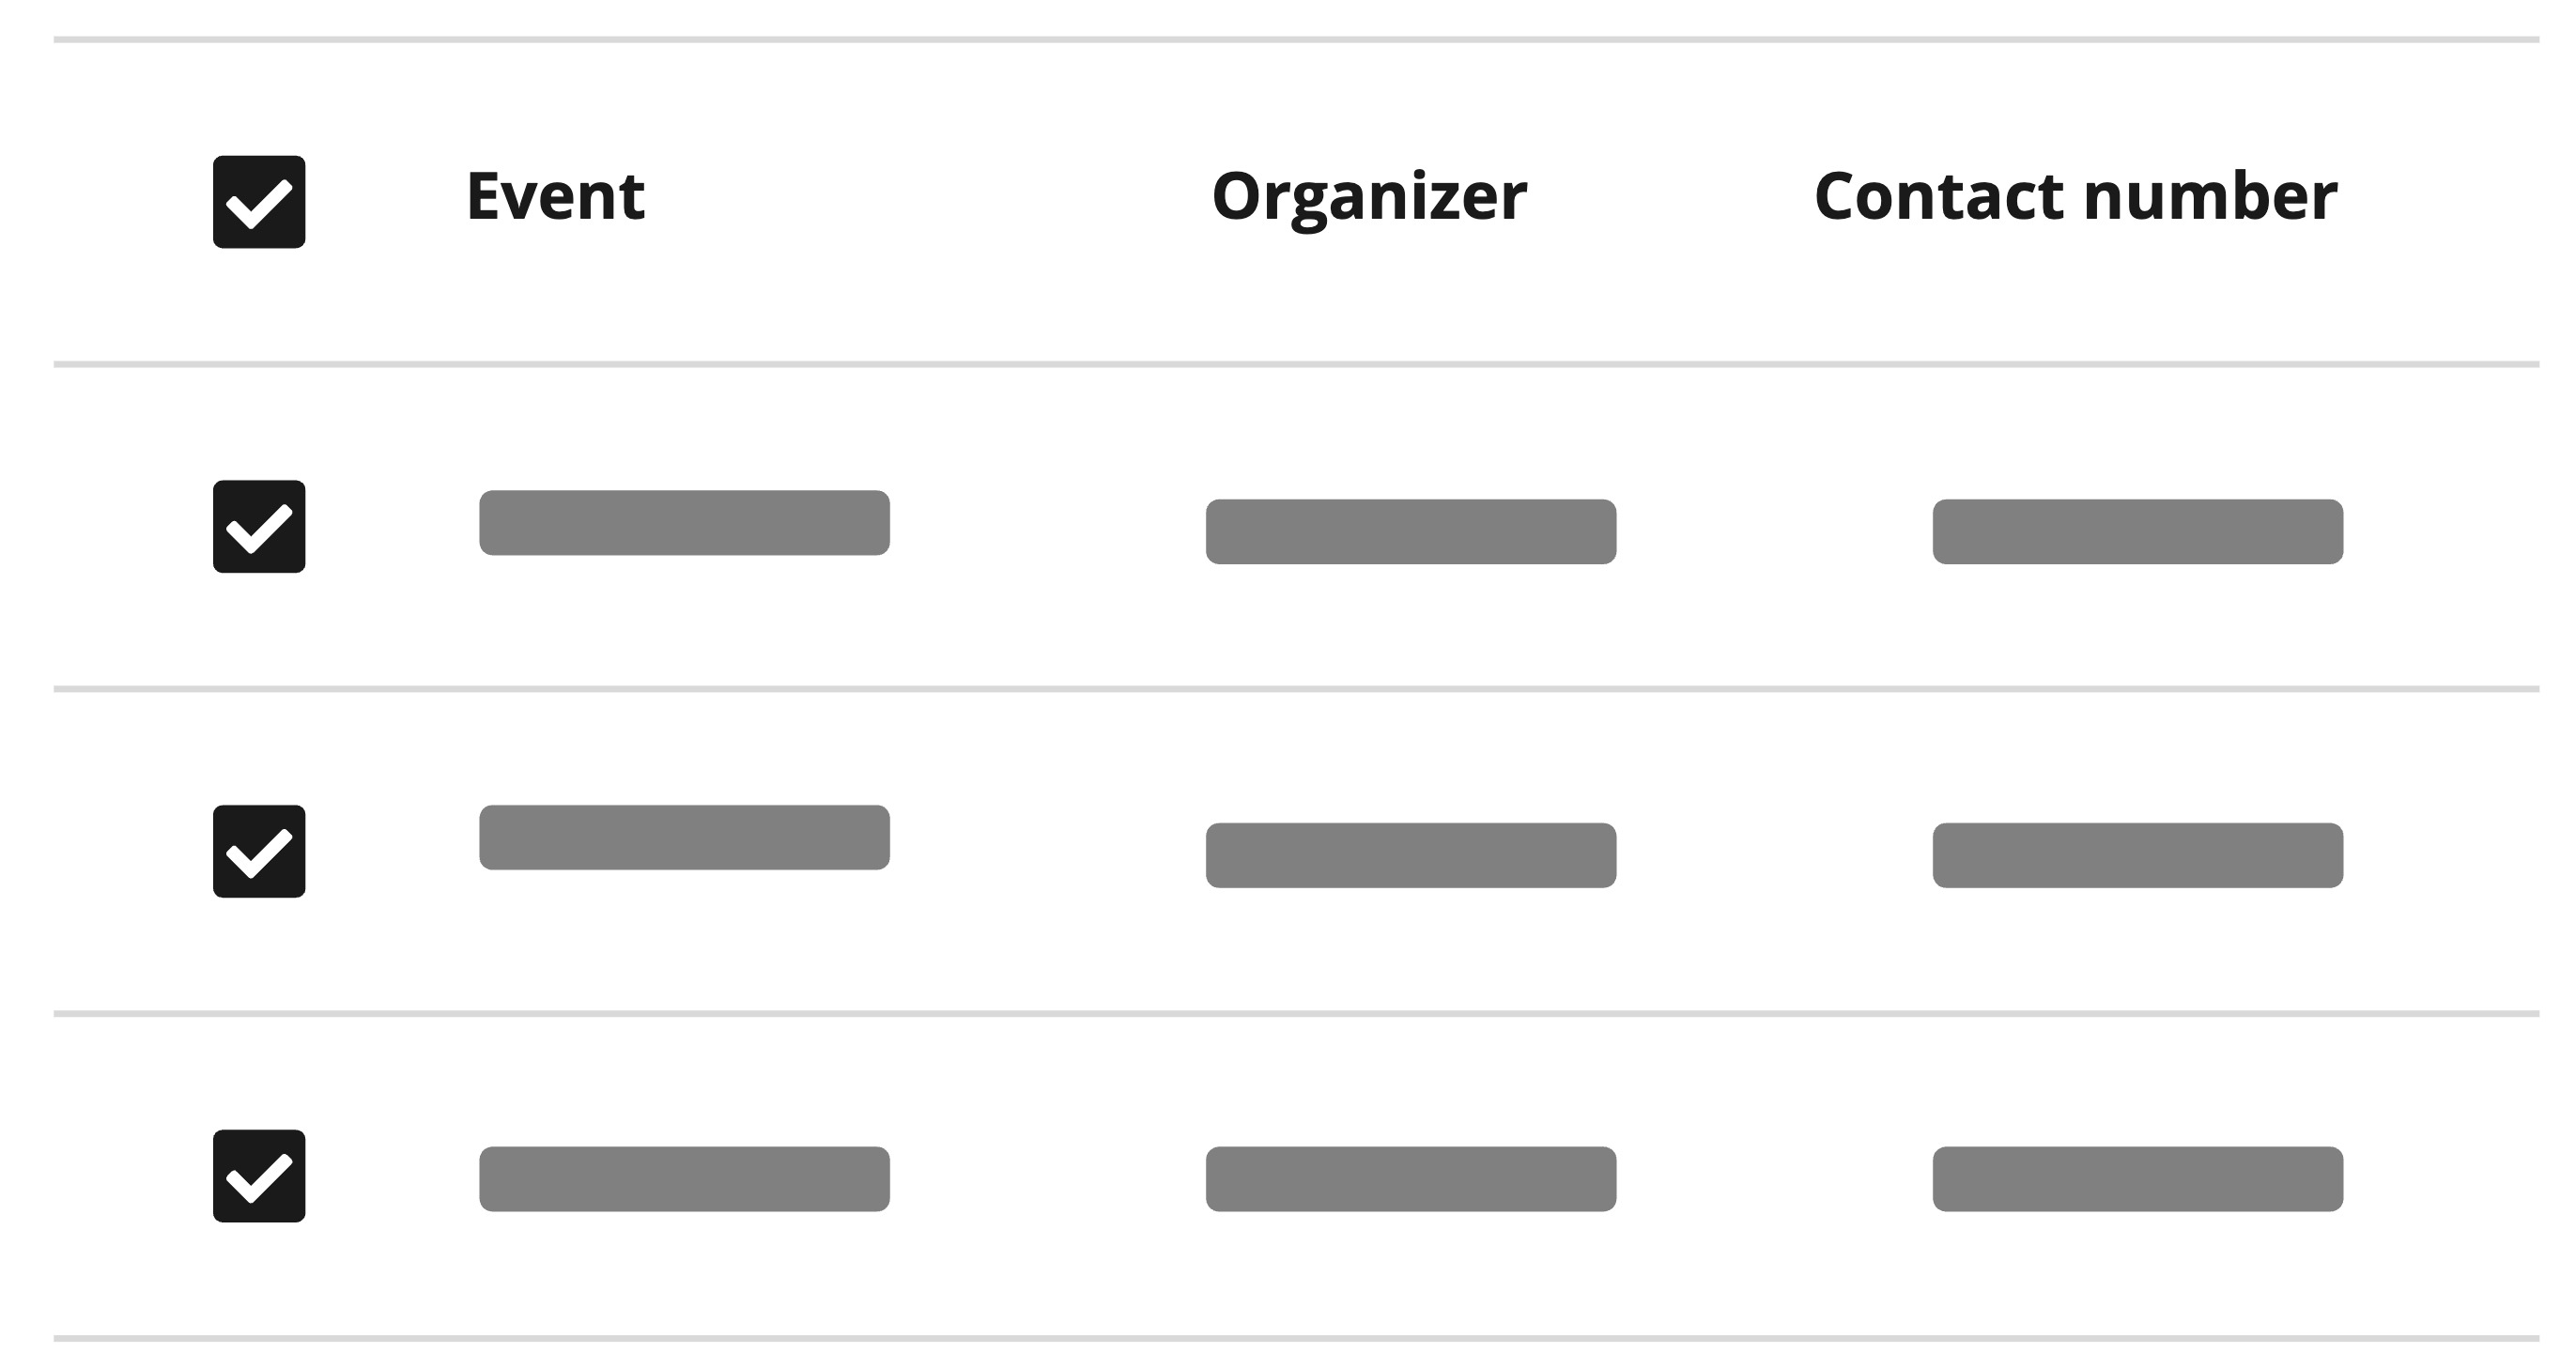
Provide descriptive column headers for each column that accurately represent the data.
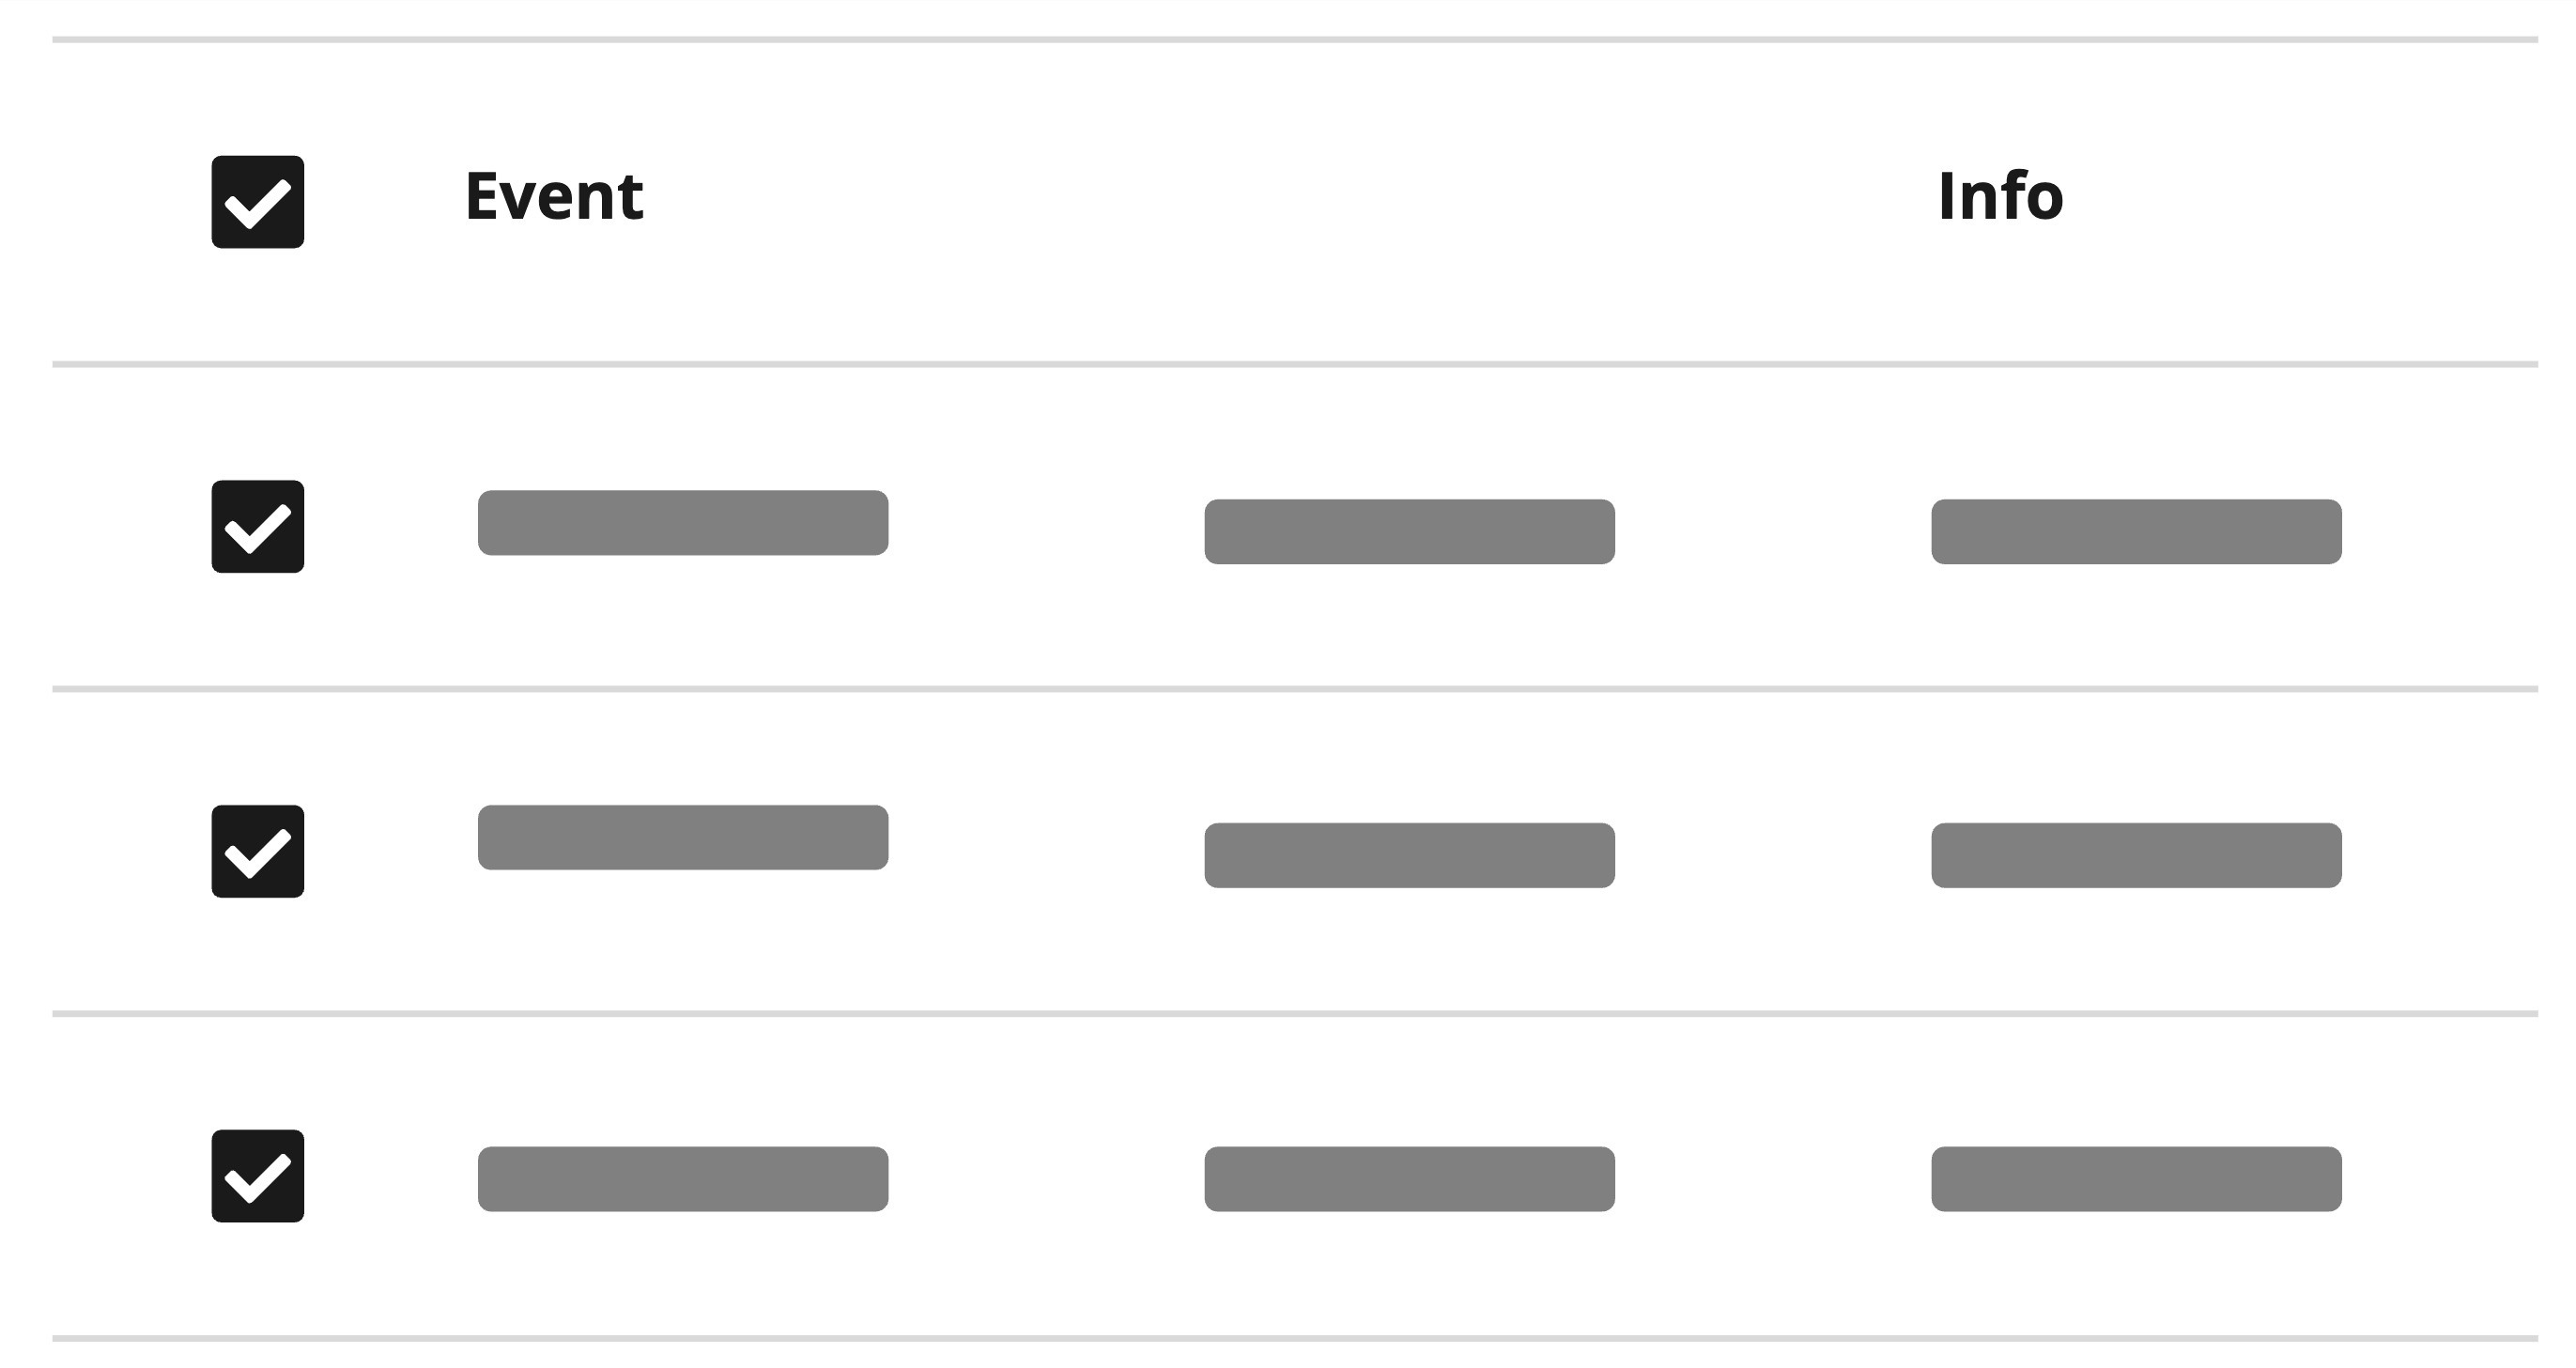
Avoid using vague or misleading column headers that do not clearly represent the data.
Variants
Default: You should use the default variant of the Table component when you want a clean, standard table appearance. It’s ideal for most use cases where you want to display tabular data clearly and simply. The default variant is a good starting point for most tables.
Muted: Use the
mutedvariant for table to reduce visual noise and improve clarity, especially in tables with extensive content. This helps users focus on the data while maintaining a clean and organized appearance.Grid: The
gridvariant is useful if you want clearer separation between columns, especially for tables with many columns or dense data. The grid variant adds vertical borders between columns, making it easier to scan and compare values across rows.Admin- and Master: Use this variant to identify rows that are only relevant for internal users. Learn more about its usage.
Display secondary information
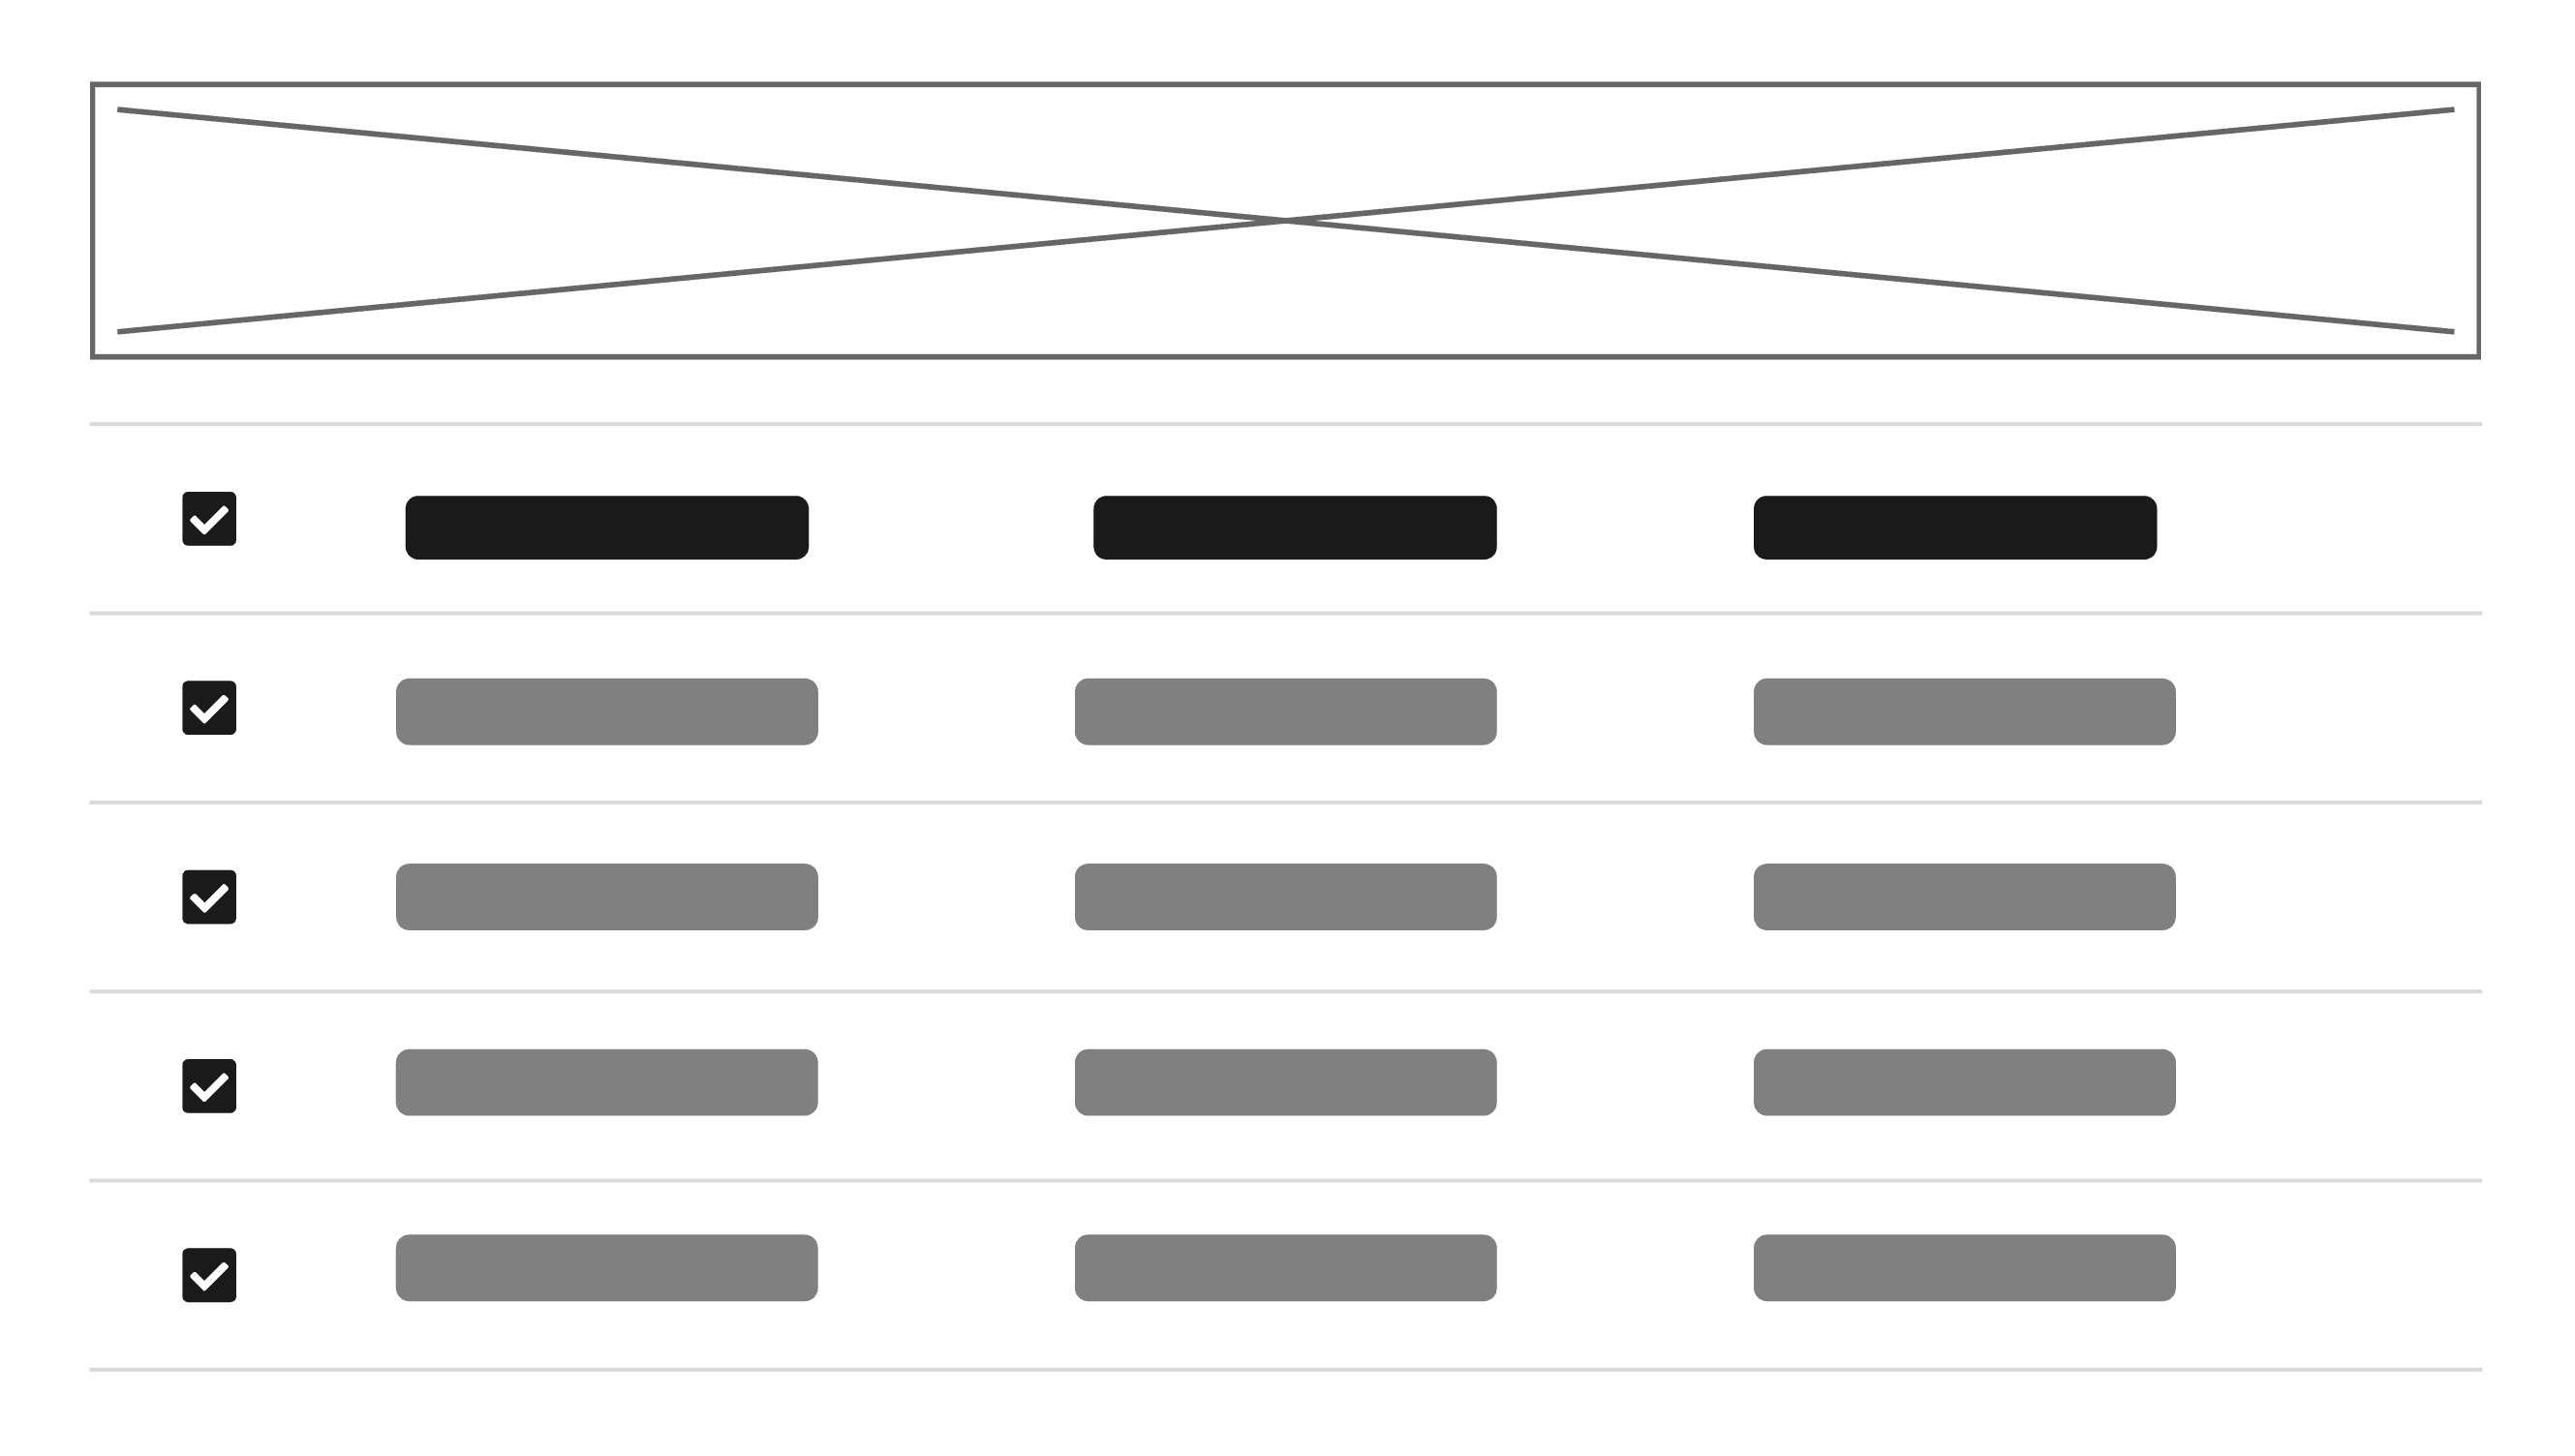
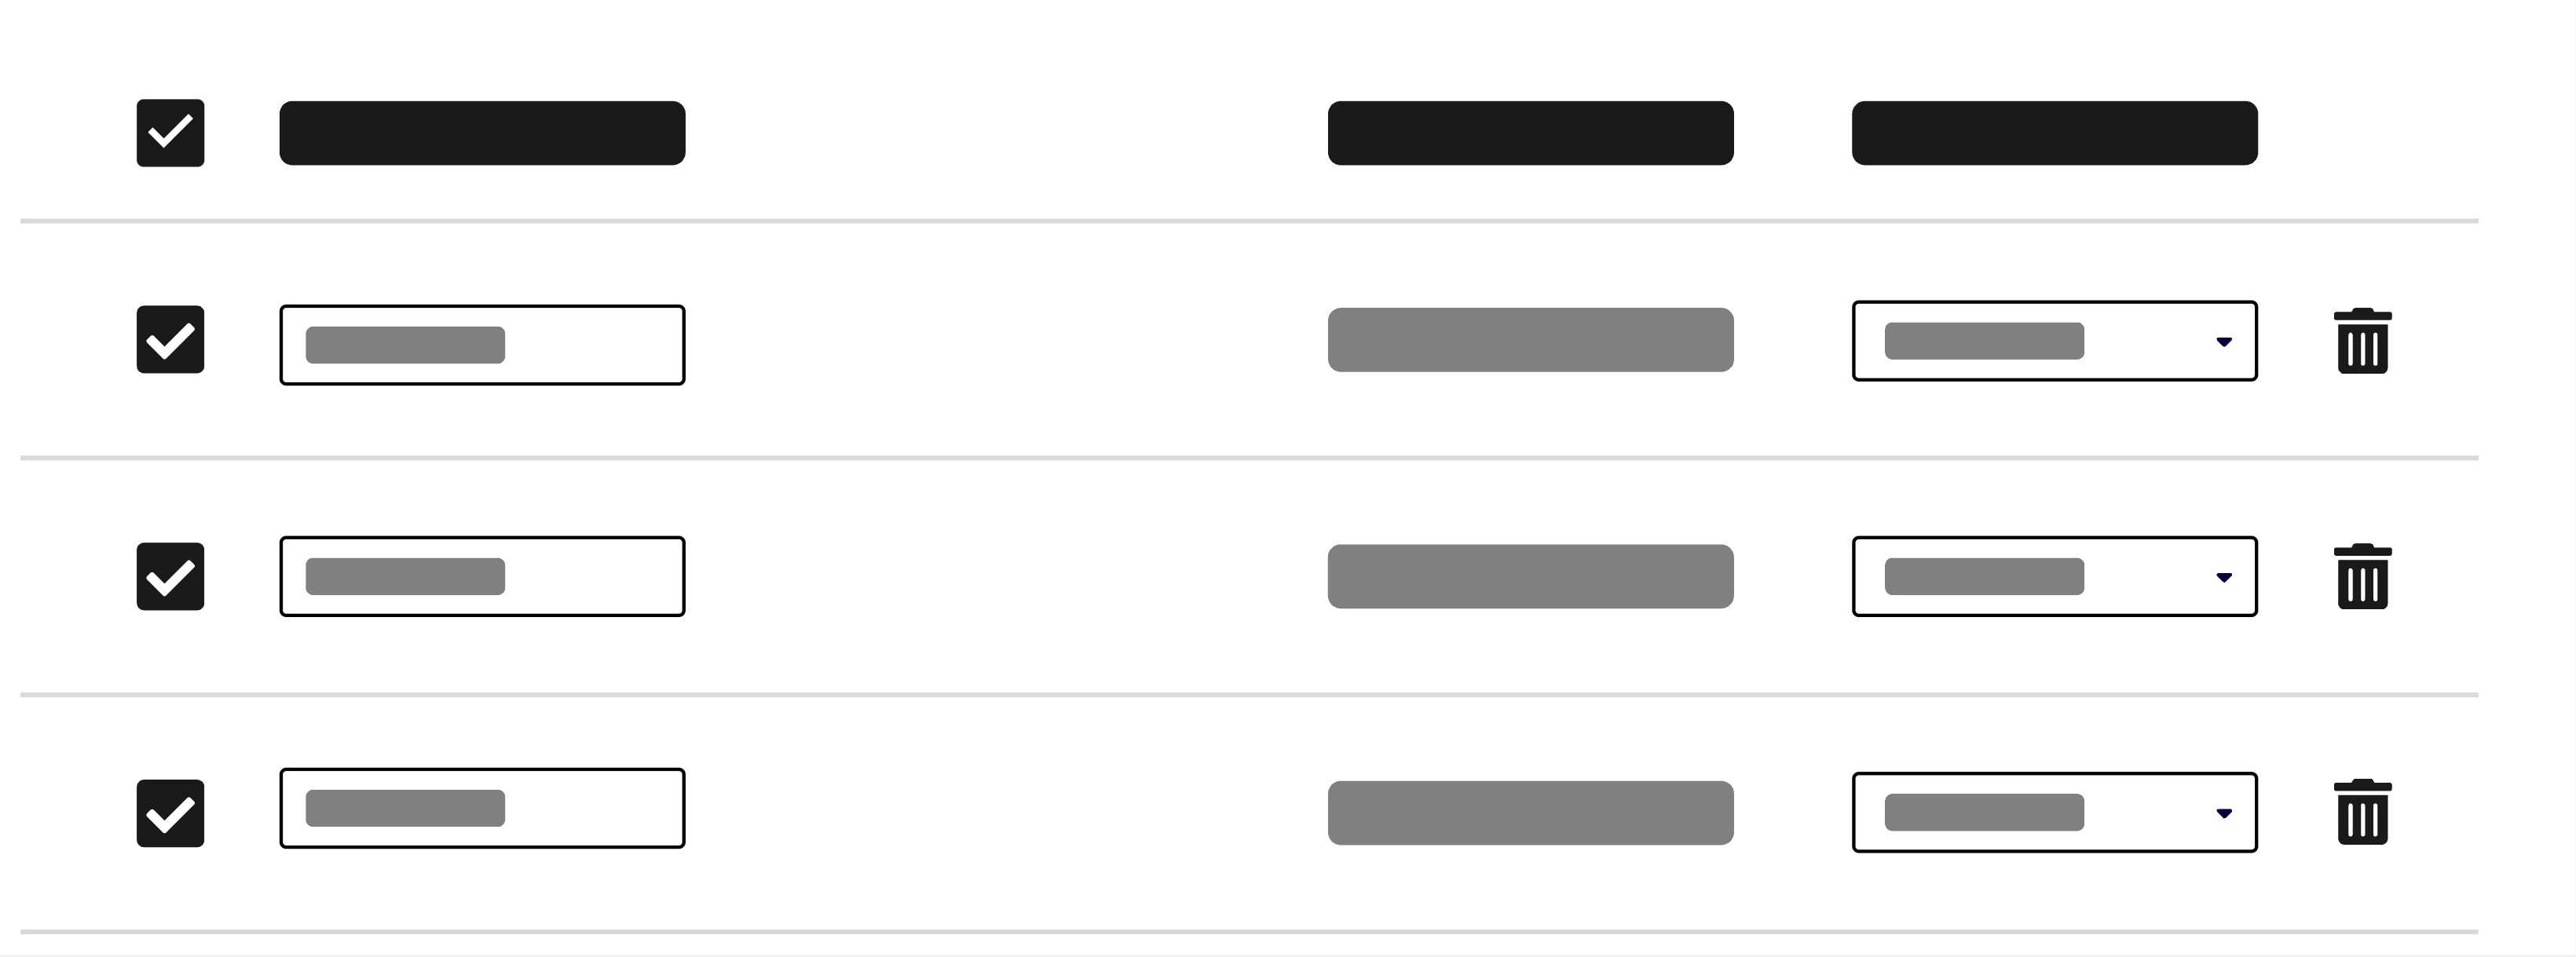
Secondary data in a cell is needed when additional context or details are necessary to fully understand the primary data. The primary data of a table cell should always be displayed clearly. It provides better readability and can improve the user experience. Too much secondary data can overwelm users and make the table complexer and harder to read.
| Id | Name | User |
|---|
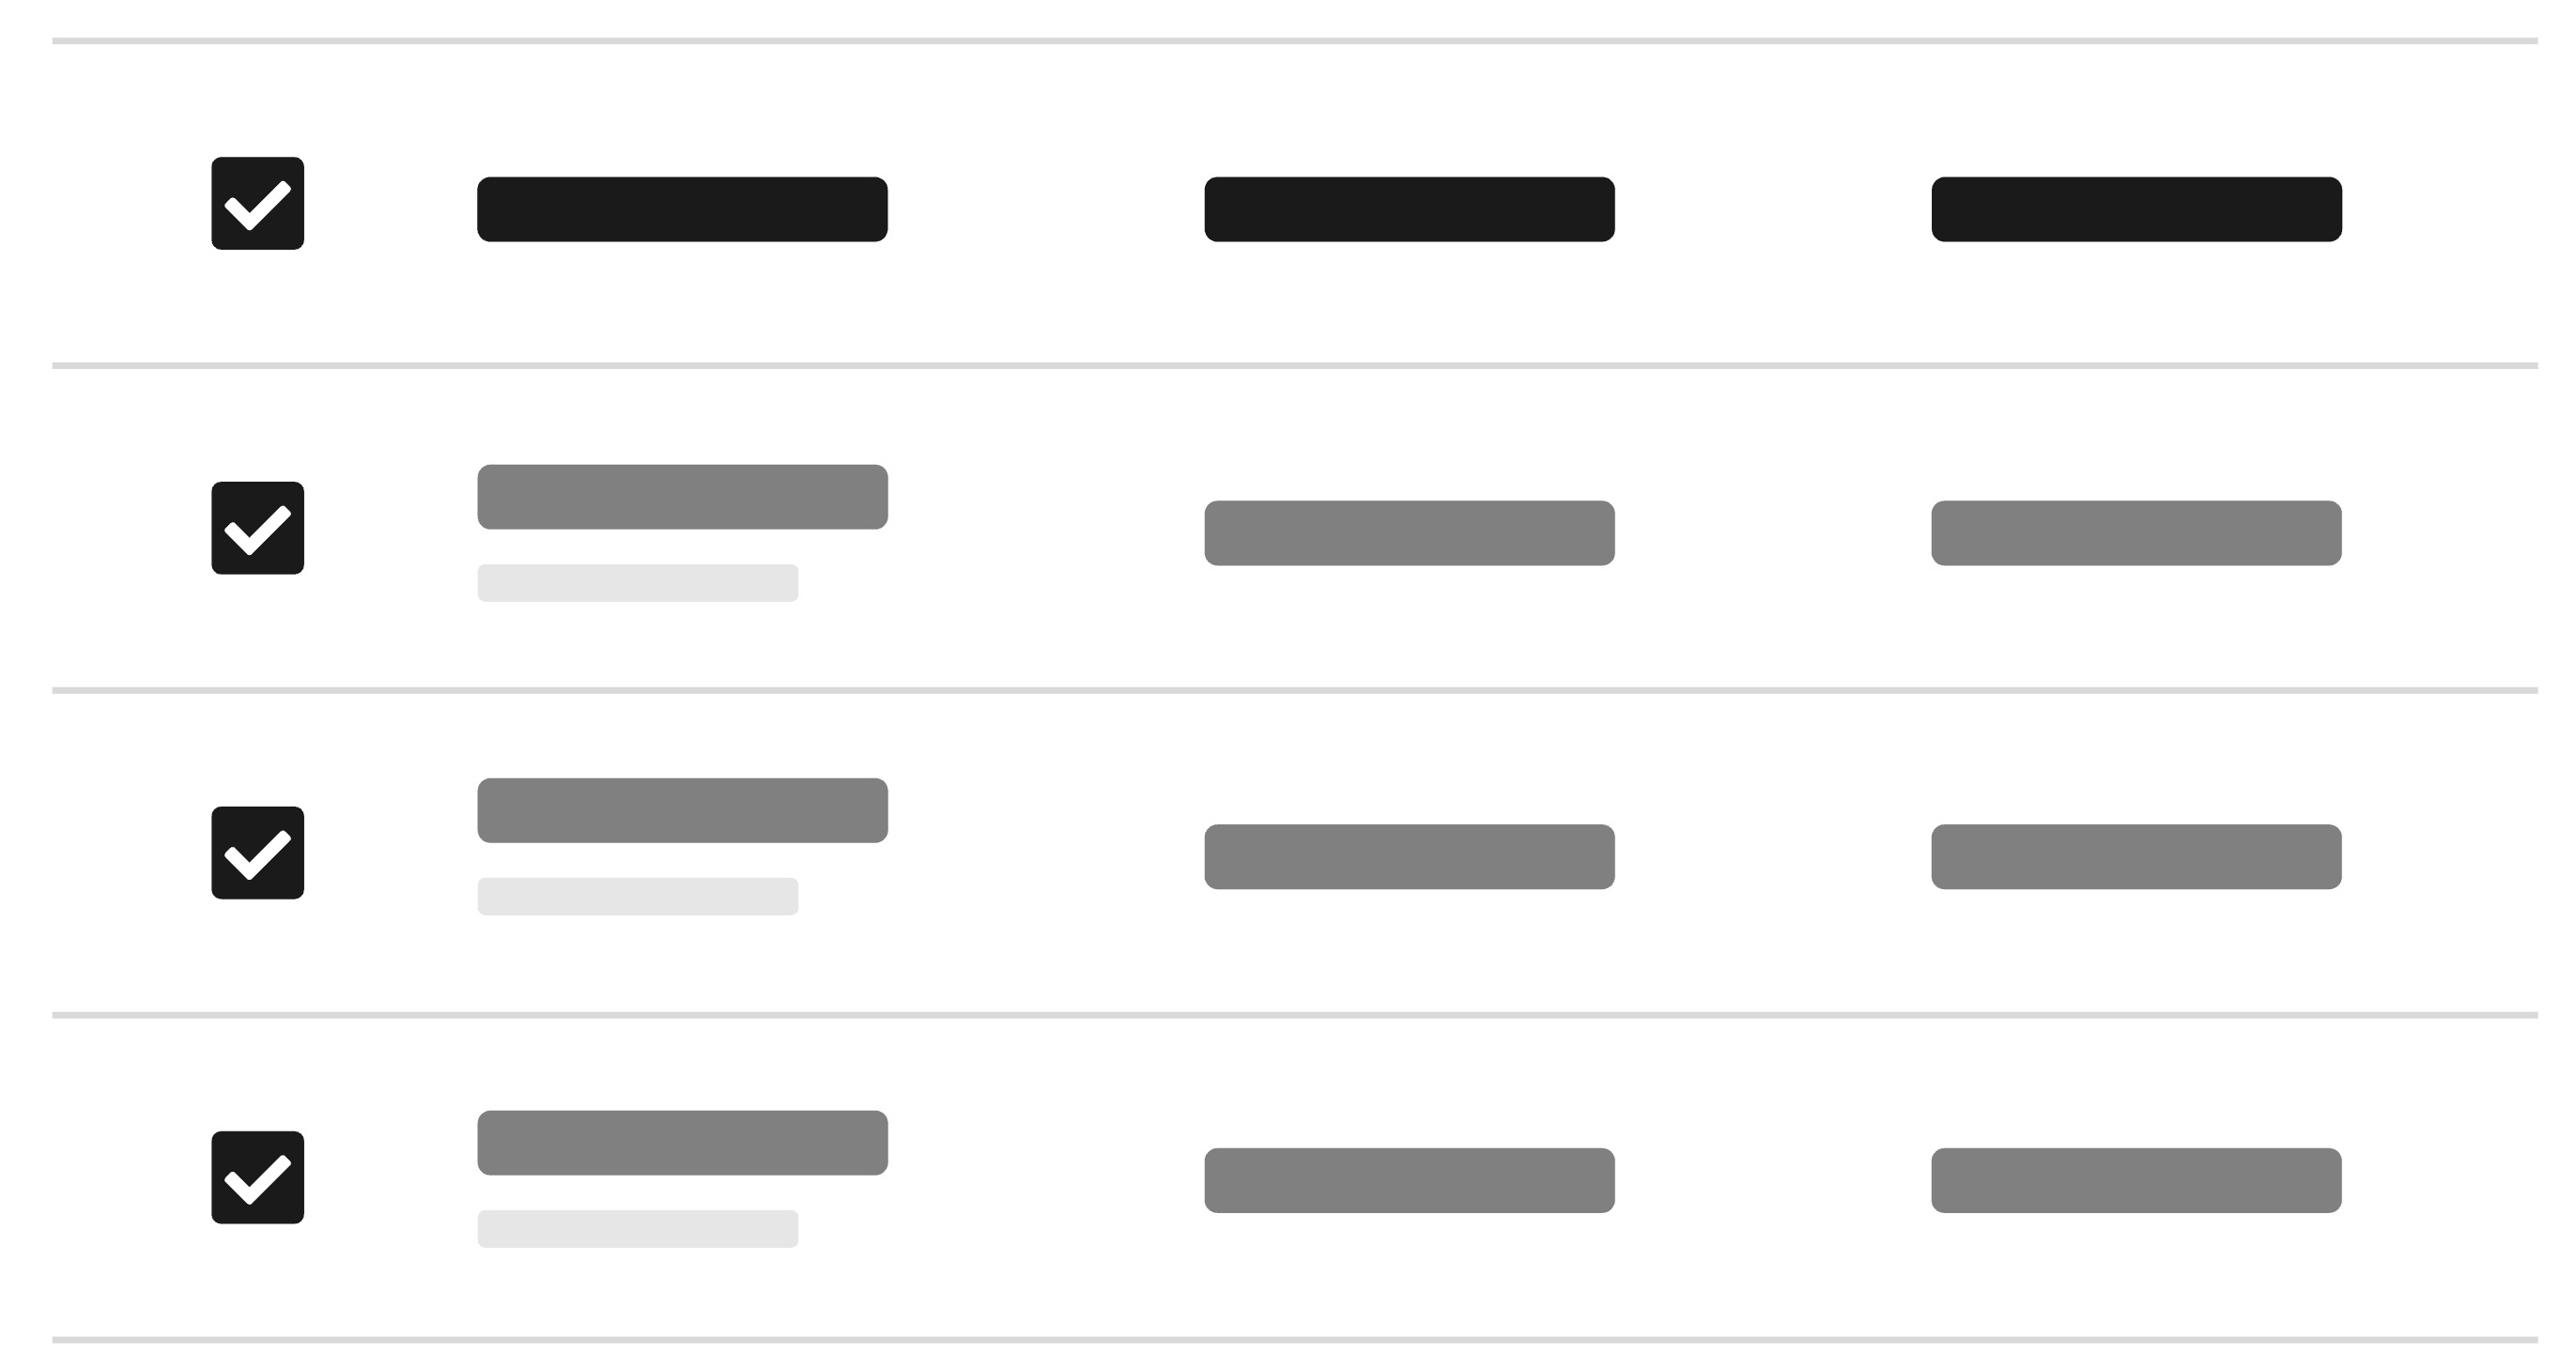
Keep cell content concise. Only add additional data when necessary to help understand the data.
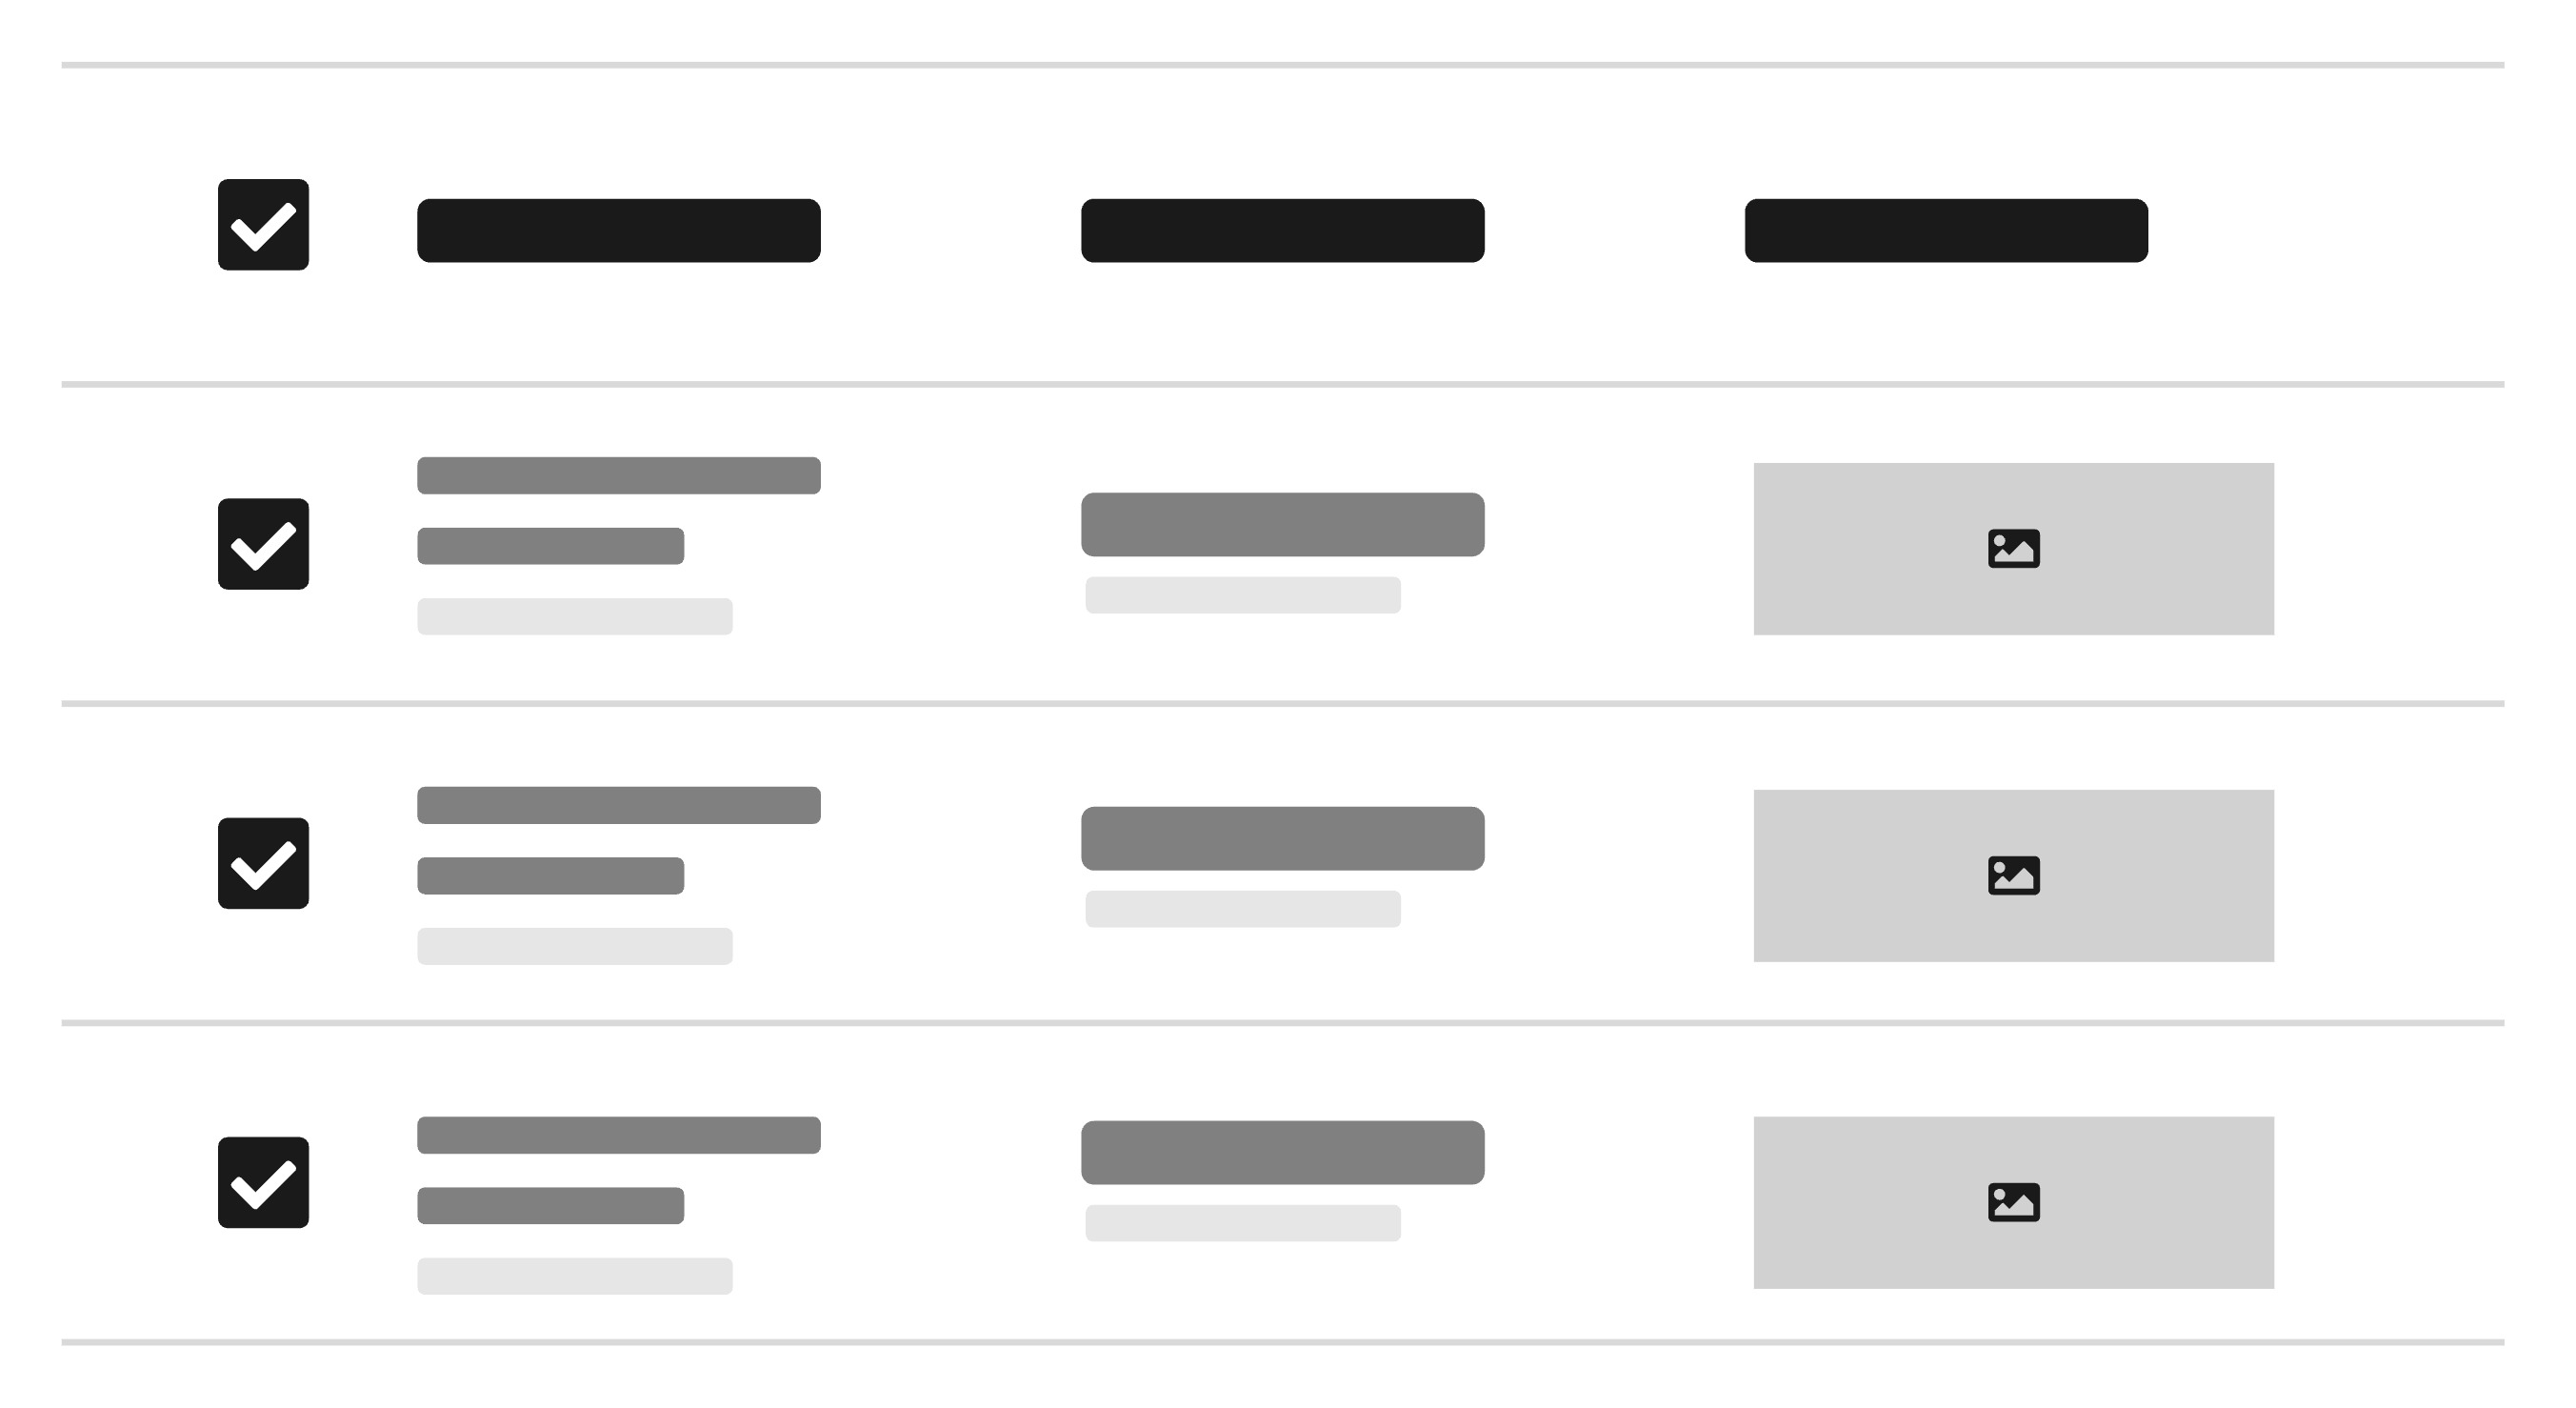
Avoid overloading cells with too much information or complex data, and multiple data values in one cell.
Sticky header
If you have large data tables, setting the header to sticky can provide context when scrolling. To do this, set the stickyHeader property on the <Table> and wrap it in the Scrollable component with a specified height, as shown in the example below.
| Id | Name | User |
|---|
Highlight data
This is an example of how you can use the <Badge> within the <Table>. Badges can be used in a table to highlight or categorize certain data, making it easier for users to quickly identify key information. This is a common use case if you need to add status indicators, categorizations, labels or tags within the table.
| Id | Event | Date | Status |
|---|---|---|---|
| 16382462873 | Concert | Mittwoch, 10. Januar 2024 | updated |
| 383262736 | Open Air Festival | Dienstag, 9. Juli 2024 | new |
| 62836432 | Live on Stage | Montag, 25. November 2024 | - |
| 82742834 | Open Air Summertime | Samstag, 1. Juni 2024 | updated |
| 78263482 | Opera | Donnerstag, 12. Dezember 2024 | new |
| 9823742 | Musical | Montag, 19. August 2024 | updated |
Place badges consistently within the table, preferably in a dedicated column.
Don't place badges randomly within the table or overload the table with too many badges.
Sorting
Enable the sorting function to help users organize and find data efficiently. This is especially useful since different user tasks may require different sorting orders.
The <Table> is sortable through allowsSorting prop on it. Sorting controls, indicated by an arrow icon, are located in the column headers and allow for ascending or descending order. For this purpose the properties onSortChange which handles the direction when changing and sortDescriptor, containing the current column and direction must be specified.
To make async sorting more convenient, you can use the useAsyncList hook. The hook manages the async list data and provides convenience methods for updating the data.
| Name | Height | Mass | Birth Year | Created |
|---|
Handling numeric values
With our formatting helper components for dates and numeric values you can easily ensure consistent and accurate display. See NumericFormat, DateFormat for more informations.
Also you see how to use the align property on the columns. With that you can set the content of a column to left, center or right.
| Event | Date | Price | Ticket Number | |
|---|---|---|---|---|
| Music Festival | Freitag, 25. August 2023 | $50.00 | 123456789 | |
| Red Carpet Theater | Sonntag, 10. September 2023 | $150.00 | 987654321 | |
| Conference | Donnerstag, 5. Oktober 2023 | $220.50 | 246813579 | |
| Sports Tournament | Montag, 20. November 2023 | $75.00 | 135792468 | |
| Opera | Montag, 15. Mai 2023 | $500.00 | 128216789 |
- Align numeric values and their header cells to the right.
- Format numbers to provide tabular numeric font style.
Nested columns
Nested columns can be useful in tables when you need to organize complex or hierarchical data in a more structured format. These columns can be nested, which will result in more than one header row to be created.
Note the usage of isRowHeader in the example below. It controls which columns are included in the accessibility name for each row. By default, only the first column is included, meaning the aria label will be on the first column only.
| Name | Information | ||
|---|---|---|---|
| First Name | Last Name | Birthday | Age |
| Sam | Smith | May 3 | 36 |
| Julia | Jones | February 10 | 24 |
| Peter | Parker | September 7 | 28 |
| Bruce | Wayne | December 18 | 32 |
Keep nested columns simple to avoid overwhelming users with too much information at once. Only use one level of nesting.
Don't use multiple levels of nested columns, this can make the table complex and difficult to navigate.
Multiple line cells
If your table contains cells with multiple lines of text, use the alignY="top" property on the <Table> component to align cell content to the top. This ensures text consistently starts at the top of each cell, making it easier to scan down columns. It also keeps buttons, text, and icons visually aligned, avoiding uneven spacing caused by varying content heights.
| Event | Description | Location |
|---|---|---|
Conference ID: EVT-001 | Annual Tech Conference Join industry leaders for a day of talks and networking. Registration required | Berlin Venue: City Expo Center |
Workshop ID: EVT-002 | React Advanced Hands-on coding session for intermediate React developers. Limited seats available | Munich Venue: TechHub |
Meetup ID: EVT-003 | Frontend Community Monthly meetup for frontend enthusiasts. Free entry | Hamburg Venue: Innovation Loft |
Webinar ID: EVT-004 | Design Systems 101 Online session covering the basics of design systems. Live Q&A included | Online Platform: Zoom |
Hackathon ID: EVT-005 | Open Source Sprint Collaborate and build open source projects in teams. Prizes for top teams | Cologne Venue: Startup Garage |
Row Actions
Row actions let users interact with individual records directly from a table, such as editing, viewing details, or triggering specific operations. These interactions are essential for working with tabular data, and thoughtful design helps users stay oriented and confident. To support clarity, predictability, and efficiency, it’s important to align how and where these actions appear.
Use the <Button> component with the secondary (default) variant for row actions. If the action is destructive, use the destructive variant instead. In both cases, apply the small button size to maintain visual consistency and minimize visual noise in dense table layouts.
When it comes to placement, always position row actions at the end of the row. This improves scannability and clearly signals which parts of the row are interactive, helping users quickly locate available actions.
| Venue | Address | Rating | Action |
|---|---|---|---|
| Main Street Park Amphitheater | 123 Main Street, Laughville | 4.7 | |
| Shakytown Comedy Club | 456 Comedy Boulevard, Shakytown | 3.6 | |
| Oak Ridge Barn | 789 Oak Road, Hee-Haw City | 2.3 |
Show only the most important 1–3 actions per row. These should be the actions users are most likely to need or expect to find without having to open a menu, such as “Edit” or “View.” If you need to support more than three actions, prioritize them by frequency and importance: display the most critical ones directly, and group the rest into a contextual menu using an <ActionMenu> (see ActionMenu section). This keeps the row clean and scannable while still offering access to all necessary actions.
Using too many visible actions at once can overwhelm users, make it hard to identify what to do, and increase visual clutter. If space is limited or the layout feels crowded, consider using icon buttons to keep actions compact. Pair them with tooltips to clearly communicate each action’s purpose without adding visual noise.
Only use icons when their meaning is clear without explanation. If the icon might be ambiguous, prefer a labeled button or add context with a tooltip.
| Venue | Address | Rating | Action |
|---|---|---|---|
| Main Street Park Amphitheater | 123 Main Street, Laughville | 4.7 | |
| Shakytown Comedy Club | 456 Comedy Boulevard, Shakytown | 3.6 | |
| Oak Ridge Barn | 789 Oak Road, Hee-Haw City | 2.3 |
If you cannot place all row actions at the end of the row, be mindful of clarity and consistency. Actions should remain visually distinct from content and navigation, and be grouped where possible to support scannability. Apply consistent styling to each action and avoid placing them in unexpected locations, as this can increase cognitive load and make it harder for users to understand what they can do in each row.
Links
Inline links for actions can sometimes be mistaken for regular content and may add visual noise, so it’s best to use them with care. A common and appropriate use of links in tables is placing one on the identifying attribute of a record, such as a name or title, when it leads to the related item or detail view.
When using links in tables, default to the standard <Link> component. If the table contains many links, consider simplifying the layout to reduce visual clutter. If links cannot be reduced, use the secondary variant of <Link> to maintain clarity and minimize distraction.
| Venue | Address | Rating |
|---|---|---|
| Main Street Park Amphitheater | 123 Main Street, Laughville | 4.7 |
| Shakytown Comedy Club | 456 Comedy Boulevard, Shakytown | 3.6 |
| Oak Ridge Barn | 789 Oak Road, Hee-Haw City | 2.3 |
| Harborfront Promenade | 101 Riverside Drive, Port Funsies | 4.2 |
Props
You don't have to hard code the table items, you could also create a dynamic collection and iterate through it. You can read more about these collections here.
Table
alignY?"top" | "middle";
"middle"children?[
ReactElement<TableHeaderProps<object>, string | JSXElementConstructor<any>>,
ReactElement<TableBodyProps<object>, string | JSXElementConstructor<...>>,
];
collection?TableCollection<object>;
defaultSelectedKeys?Iterable<Key> | "all";
disableKeyboardNavigation?boolean;
"false"disabledBehavior?DisabledBehavior;
disabledKeys applies to all interactions, or only selection.disabledKeys?Iterable<Key>;
disallowEmptySelection?boolean;
emptyState?() => ReactNode;
focusMode?"row" | "cell";
'row'onCellAction?(key: Key) => void;
onRowAction?(key: Key) => void;
onSelectionChange?(keys: Selection) => void;
onSortChange?(descriptor: SortDescriptor) => any;
selectedKeys?Iterable<Key> | "all";
selectionBehavior?SelectionBehavior;
selectionMode?SelectionMode;
"none"sortDescriptor?SortDescriptor;
stickyHeader?boolean;
"true"stretch?boolean;
"false"Table.Header
childrenColumnElement<T> | (ColumnElement < T > []) | ColumnRenderer<T>;
Column(s) or a function. If the latter, a list of columns must be provided using the columns prop.columns?T[]Table.Column
allowsResizing?boolean;
allowsSorting?boolean;
childColumns?T[]childrenReactNode | ColumnElement<T> | (ColumnElement < T > []);
defaultWidth?ColumnSize | null;
isRowHeader?boolean;
maxWidth?ColumnStaticSize | null;
minWidth?ColumnStaticSize | null;
textValue?string;
title?ReactNode;
children contains child columns.width?WidthProp;
Table.Body
childrenRowElement<T> | (RowElement < T > []) | ((item: T) => RowElement<T>);
items?Iterable<T>;
loadingState?LoadingState;
onLoadMore?() => any;
Table.Row
childrenCellElement | CellElement[] | CellRendererdownload?string | boolean;
href?string;
hrefLang?string;
ping?string;
referrerPolicy?HTMLAttributeReferrerPolicy;
rel?string;
routerOptions?undefined;
target?HTMLAttributeAnchorTarget;
textValue?string;
Table.Cell
childrenReactNode;
colSpan?number;
textValue?string;
Alternative components
Choosing the right alternative to data tables is crucial for effectively displaying your data and enhancing user interaction. Depending on the type of data and the desired user experience, different components can offer different benefits. Here are some alternatives to data tables that might better suit your needs:
SelectionList: Displays a list of interactive items, useful to create an actionable list of related items, such as a list of users.
Cards: Helpful if the data needs to be displayed with more visual hierarchy. Keep in mind that you can't compare data in this way not as good as tables, because the eyes have to move much more.
List: When presenting a simple, linear collection of items, often with less data per item. Easy to read and navigate, especially for data that doesn’t require complex organization.
Grid: Layout in a table-like structure. This gives you full control over the size of the columns and rows and allows you to align them according to your needs.
Columns: Create columns in one row, useful if you need to align content in a table-like way with fewer rows.
Is there still not the right alternative for you please get in touch with us!